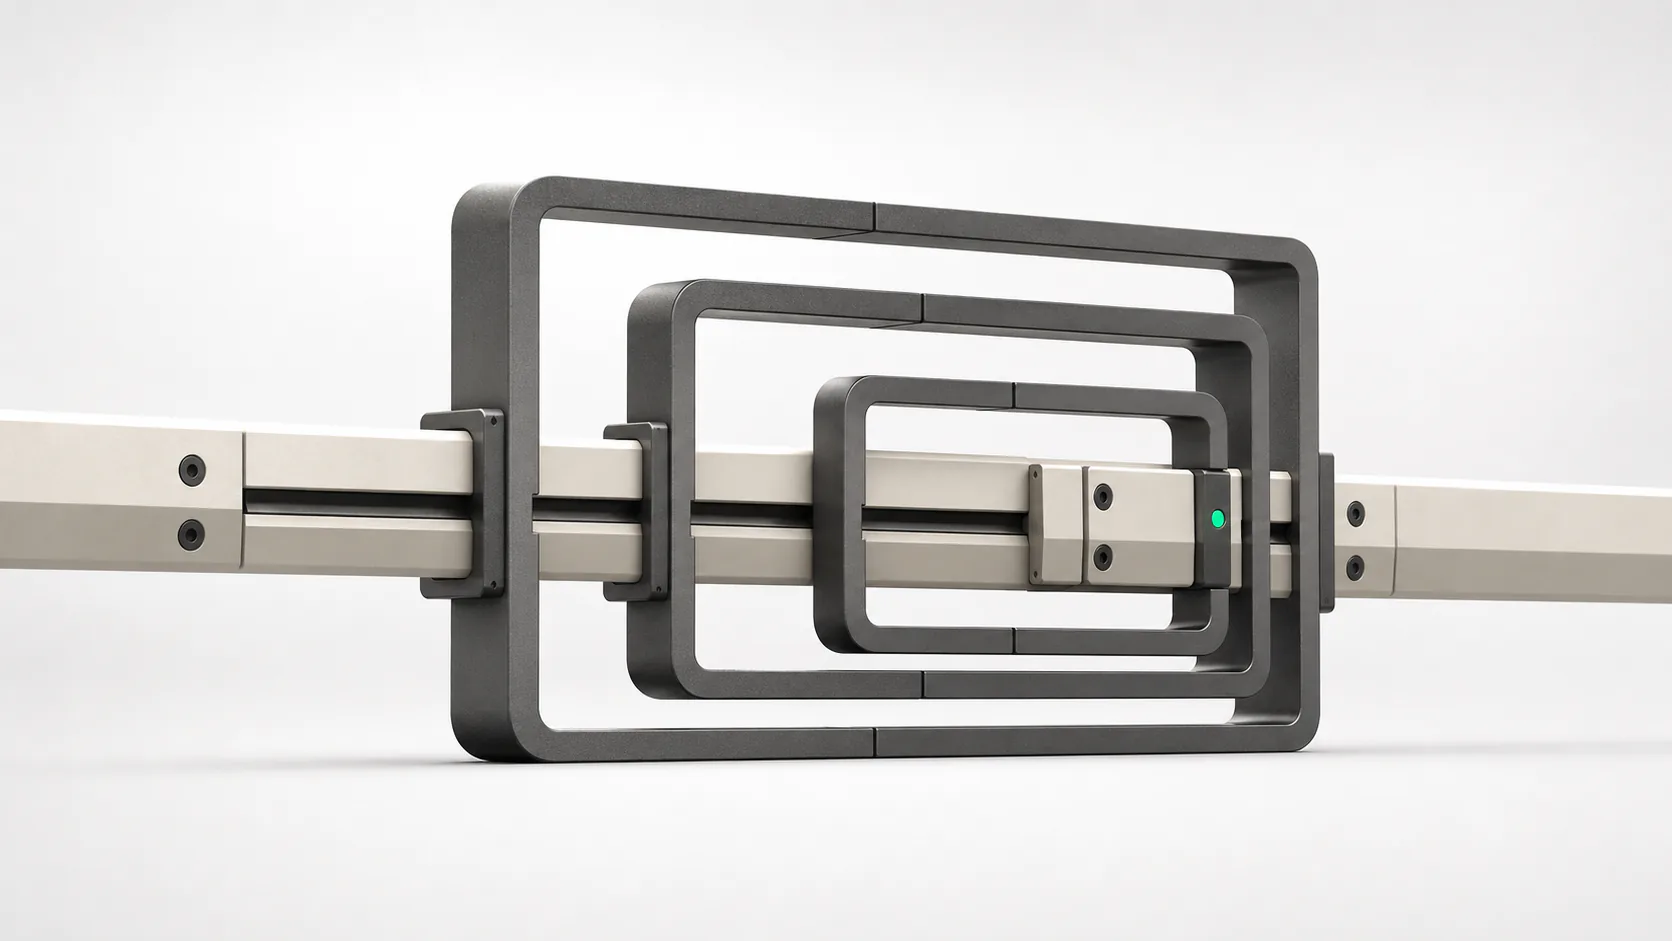
One live model keeps context intact instead of rebuilding it from isolated screenshots
Open a market on the dashboard, move into Ryver, let the laptop sleep, and return later. The software has one job before it can show anything useful: recover a current, coherent view.
That sounds like infrastructure. To the person at the screen, it feels much simpler. The market should still be the same market when they move between views or return after an interruption.
Continuity is the edge we care about.
A change can matter at one scale and not another
Each instrument carries related price ranges. Smaller ranges respond to shorter movement. Larger ranges hold broader context. A price change can complete a small range while leaving a larger one untouched.
The difference is useful because it shows where movement has appeared and whether it has reached the wider structure. A person can inspect more or less detail without learning a new visual grammar. The object stays a range; only its size changes.
This relationship should survive every surface. A dashboard card offers quick orientation. The Box view makes nested state explicit. Line favors continuity. Ryver shows the sequence of completed movement. Trend Hints watches selected conditions across the same family of ranges.
When those views agree, navigation feels natural. When they disagree, the interface feels haunted. A control changes in one place but not another. A card shows an old direction. A detail view opens with different context from the tile that led there. Each flaw is small in isolation and corrosive in use.
Live includes the return
Real-time products are usually demonstrated under perfect conditions: a connection opens, data moves, and the screen updates. Ordinary life is less cooperative. Browsers sleep. Wi-Fi changes. A tab sits untouched. A person returns after enough time that the screen’s last state cannot be trusted.
We treat the return as part of the live experience. The view needs to recognize incomplete context, recover from a point it understands, and avoid presenting an old reading as the live edge. Speed matters after coherence.
The interface should communicate this without turning recovery into a technical dashboard. A person needs to know whether the view is active, catching up, or unable to continue. They do not need to learn the internal route each update traveled.
Shared state reduces translation
Continuity also protects the user’s choices. A saved dashboard arrangement, a range-size exception for one market, and the place someone is inspecting in history should not reset because live data arrives.
We learned this through small failures. An early color change affected which boxes were visible. Reordering a grid could disturb subscriptions underneath it. A global slider could erase a deliberate per-market setting. The calculations were alive, yet the experience was not continuous.
Fixing those edges changed how we define real time. It is not a race to paint the latest number. It is an agreement between current market state, the view that explains it, and the choices the user already made.
Continuity cannot reveal what the market does next. It gives every surface the same present to work from.